

Why Your Cloud Bill Keeps Growing (And How to Stop It)
How idle resources, zombie assets, and silent sprawl bleed your budget—and what you can actually do about it.

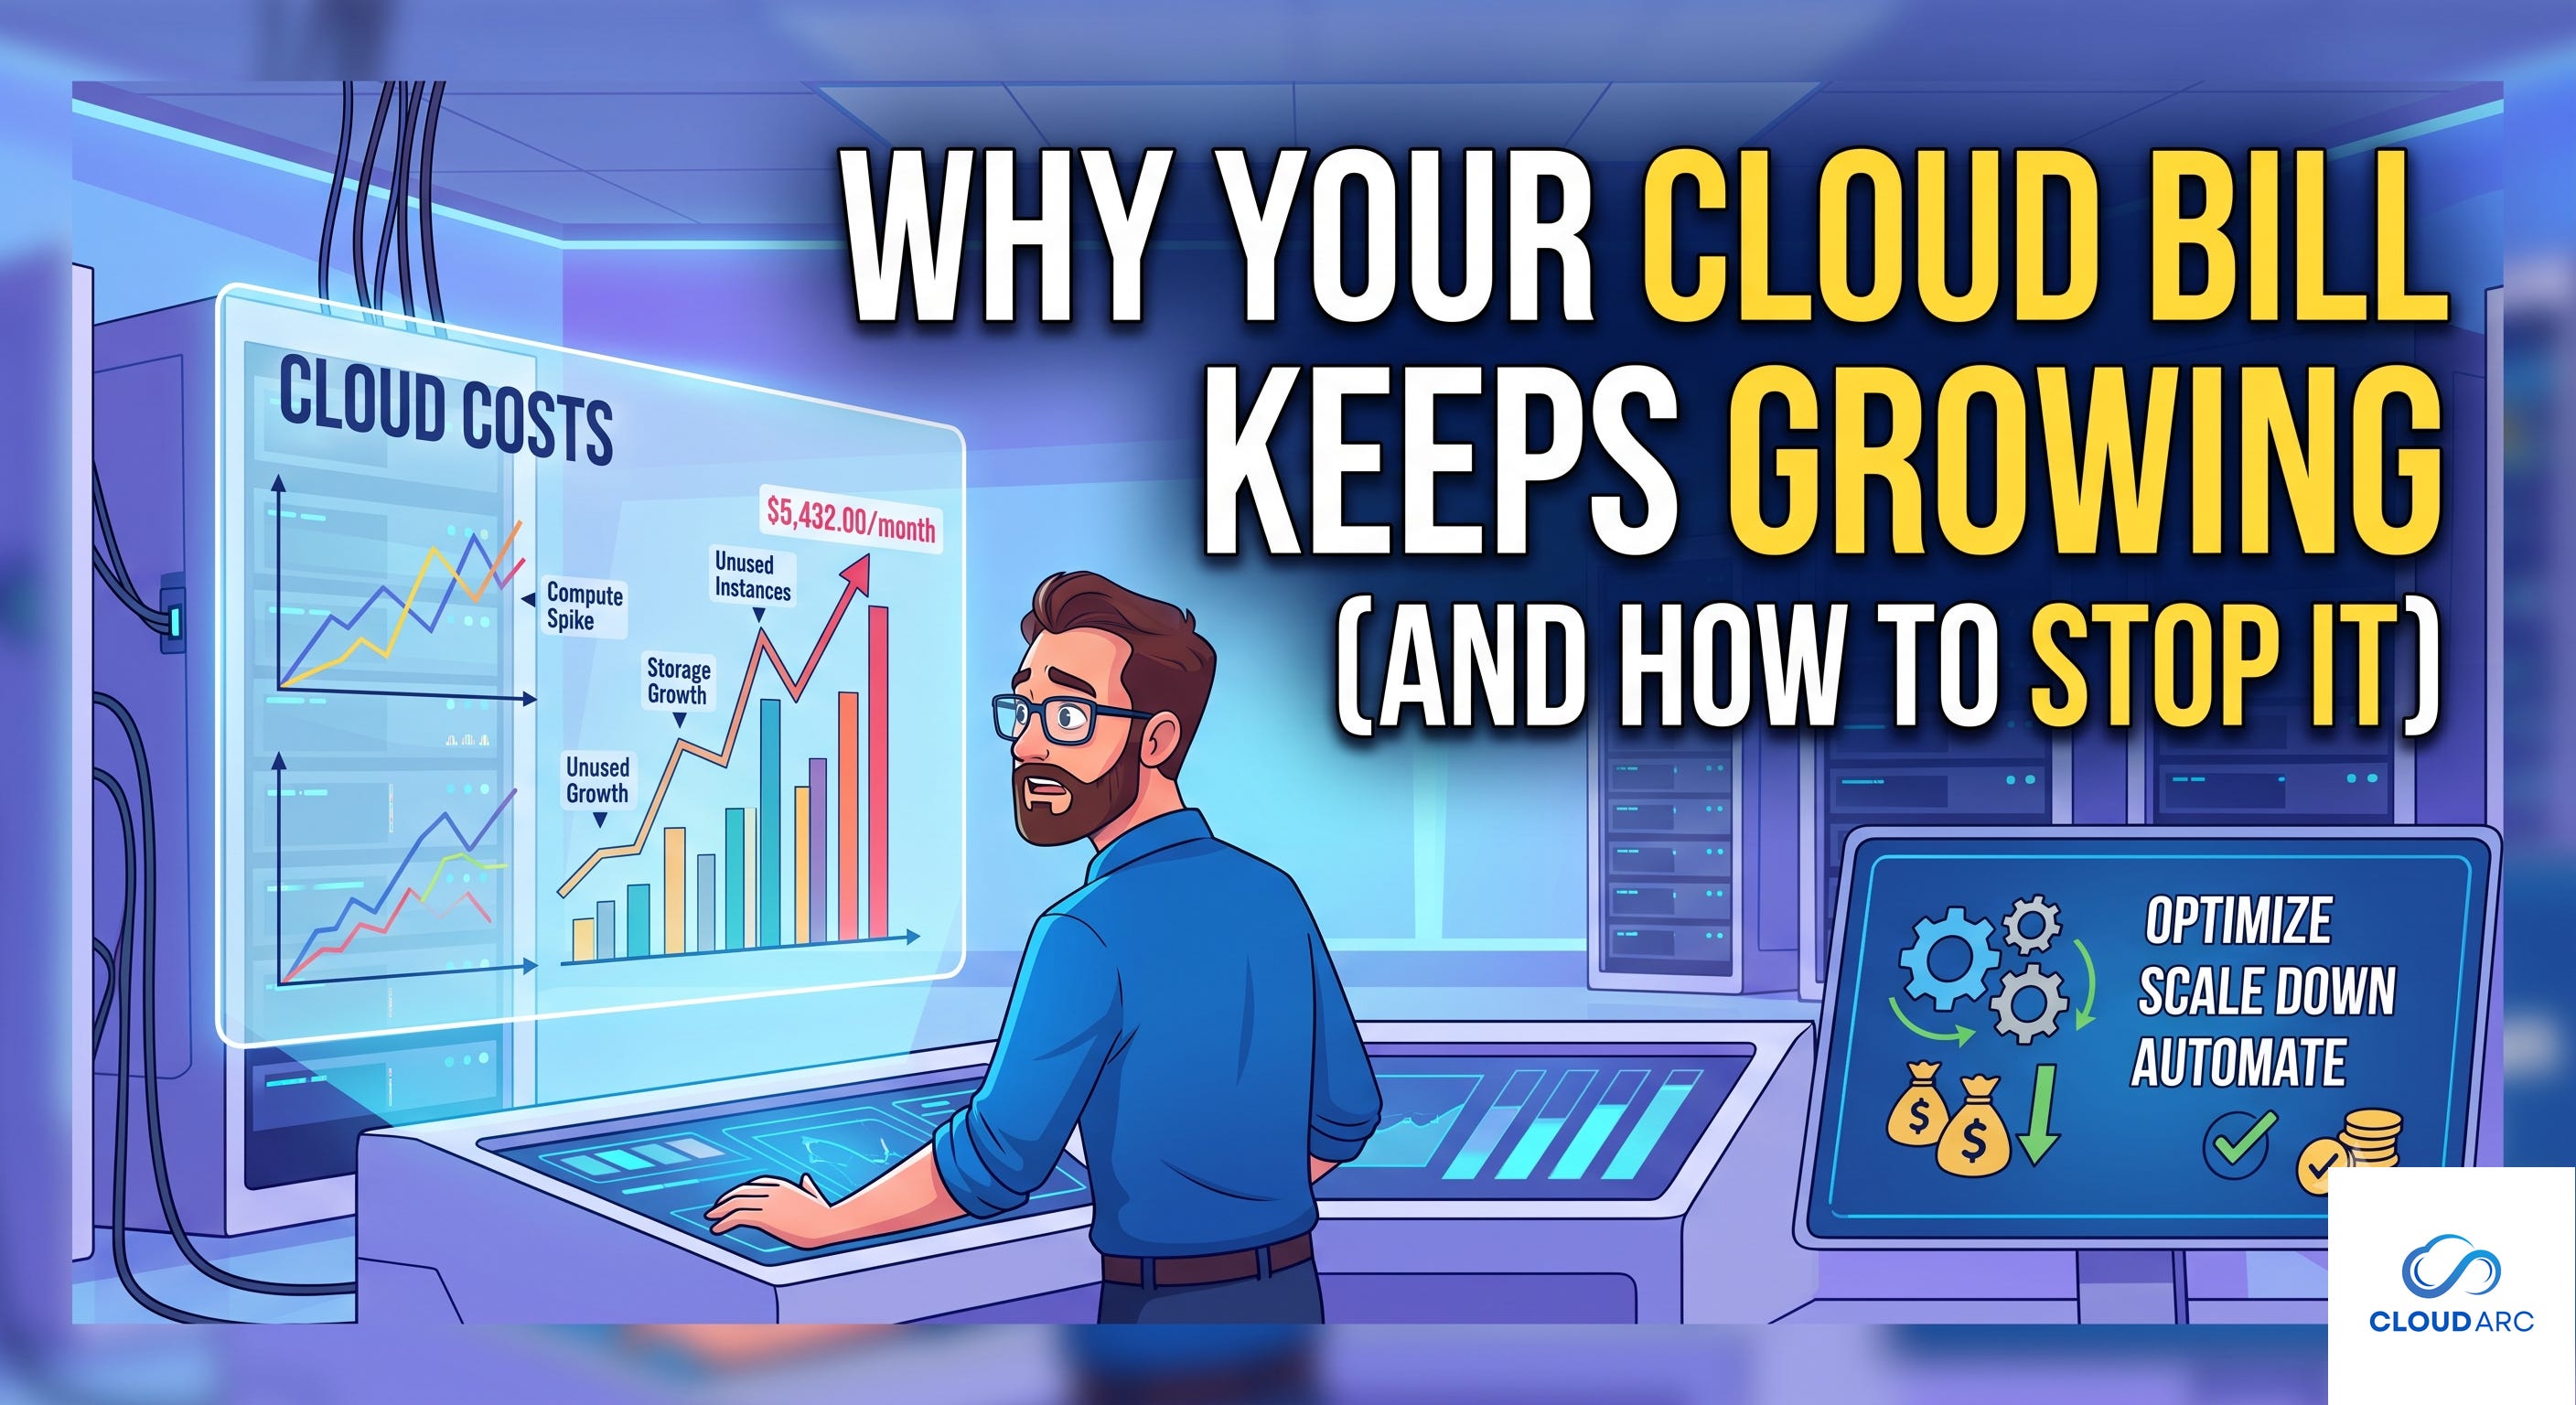
You open the invoice. It’s higher again.
Last month it was a surprise. This month it’s a pattern. Next month it’ll be a problem you can’t ignore.
The CFO is asking questions. The engineering team swears nothing changed. And somewhere in your cloud console, dollars are evaporating.
Sound familiar?
You’re not imagining it. Cloud bills don’t grow because you’re careless—they grow because the system is designed to make it easy to spend and hard to see. Every rushed deployment, every “temporary” test instance, every forgotten backup quietly adds to the total.
By the time you notice, the number has four more digits than you budgeted for.
This post breaks down where the money actually goes, how to find it, and what you can do today to stop the bleeding—plus where most teams hit a wall and how to get unstuck.
Diagnosis: Why Cloud Bills Grow (Even When You’re Careful)
Cloud spend doesn’t spiral because of one bad decision. It spirals because of a hundred invisible ones.
The Hidden Cost Drivers
1. Zombie Resources
These are resources that were spun up for a project, a test, or a migration—and never torn down.
Orphaned EBS volumes after EC2 termination (still charging for provisioned IOPS)
Unassociated elastic IPs ($0.005/hour each, 24×7×365 = $43.80/year per IP)
Idle load balancers with no healthy targets (AWS ALB: ~$16+/month + LCU charges)
Old EBS snapshots tied to retired instances
The worst part? They don’t show up in usage metrics. They just show up on the bill.
2. Oversized Instances
Engineers default to larger instance types “just in case.” It feels safer. It’s not.
A
c5.2xlarge(8 vCPU, 16 GB RAM) costs ~$340/month on-demand inus-east-1Most workloads sit at 15–25% CPU utilization on average
You could be paying 4× what you need for 25% of the year
Right-sizing isn’t a one-time task. Workloads change, but instance types don’t automatically adapt.
3. Data Transfer Costs
This one sneaks up on you.
Inter-region traffic: AWS charges $0.01–$0.02/GB between regions
Egress to internet: $0.09/GB first 100GB, then $0.085+
Cross-AZ traffic: $0.01/GB each direction
A backup job that moves 500GB/day across regions costs ~$150/month in transfer alone. Multiply that across environments, services, and microservices.
4. Unused Managed Services
RDS, Elasticache, OpenSearch—they bill by the hour whether you query them or not.
Dev/staging databases left running overnight
Multi-AZ enabled where failover isn’t needed
Backup retention set to 35 days when 7 would suffice
5. Tagging Gaps
If you can’t attribute cost to a team, project, or environment, you can’t hold anyone accountable.
Tags aren’t just metadata—they’re governance. Without them, cost shows up as “AWS” instead of “Team Alpha’s prototype.”
The Structural Problem
The cloud operating model incentivizes velocity. You can provision in seconds. But decommissioning requires memory, process, and discipline—which no one enforces in the rush to ship.
Cloud providers don’t hide costs. They just spread them across hundreds of line items in a 30,000-row CSV that no human reads.
Partial Solution: What You Can Do Today
You don’t need a full FinOps team to make progress. Here’s a practical triage approach.
Step 1: Enable Cost Visibility Tools
If you’re on AWS:
Enable AWS Cost Explorer (free, built-in)
Create AWS Budgets for monthly alerts at 50%, 75%, 90% thresholds
Use Trusted Advisor (Basic tier) for idle resource detection
If you’re multi-cloud:
Try CloudHealth, Kubecost for unified dashboards
Cycle through provider-native tools for the first pass
Quick win: Export last month’s bill to CSV and sort by UnblendedCost. The top 10 resources will typically account for 60–70% of your spend. Look at those first.
Step 2: Hunt Zombies
Run these checks in your AWS console (or equivalent):
Orphaned EBS volumes: Navigate to EC2 → Volumes → filter by “Available”. Look for volumes that have been detached for more than 30 days.
Unassociated elastic IPs: Navigate to EC2 → Elastic IPs. Look for IPs with a null Instance ID.
Idle load balancers: Navigate to EC2 → Load Balancers. Look for load balancers with 0 registered instances or targets.
Old snapshots: Navigate to EC2 → Snapshots. Look for snapshots older than 90 days that are unattached.
Unused AMIs: Navigate to EC2 → AMIs. Look for private AMIs that haven’t been launched in 6 months.
Delete or snapshot-archive anything older than 90 days unless you have a documented retention policy.
Step 3: Right-Size Oversized Instances
Tools:
AWS Compute Optimizer (free, ML-based recommendations)
CloudWatch metrics: Check
CPUUtilizationover 14 daysKubecost: Show right-sizing recommendations across K8s clusters
Rule of thumb: If a resource has been under 40% CPU for 30+ days, it’s a right-sizing candidate.
How to do it safely:
Snapshot the instance / database
Note the current instance type
Launch a new instance at lower tier
Validate in staging
Swap DNS or target group registration
Terminate the old instance
Step 4: Optimize Data Transfer
Consolidate to fewer regions when possible (replicate only what you need)
Use VPC endpoints to avoid cross-AZ charges for AWS services
Enable Intelligent-Tiering in S3 for infrequently accessed data
Review CloudFront—sometimes it reduces egress, sometimes it multiplies requests
Step 5: Implement Tag Governance
Even basic tags make a difference:
Environment — Distinguish between dev, staging, and prod environments.
Team — Enable accurate cost allocation across teams.
Project — Attribute resources to specific initiatives.
Owner — Identify who to contact before deletion.
Enforce with:
Tag policies via AWS Organizations
CI/CD pipeline checks (reject un-tagged resources)
Lambda scripts that tag “unknown” resources and alert
Step 6: Set Up Automated Cost Alerts
You shouldn’t find out about overspend at the end of the month.
Set up:
Weekly spend vs. budget notifications
Anomaly detection alerts (AWS Cost Anomaly Detection, now GA)
Daily high-cost resource reports
Gap Introduction: When DIY Hits a Wall
If you follow the steps above, you’ll typically save 15–30% within 60 days.
But then you’ll hit the hard part:
Recommendations pile up faster than you can review them. AWS Cost Explorer may suggest 400+ changes. Which ones matter? Which risks are acceptable?
Engineering pushback. Right-sizing sounds good until someone’s service latency spikes. You need safe rollback plans and performance baselines—not just a smaller instance.
Organizational friction. Who owns cost reduction? Engineering? Finance? The platform team? Without clear ownership, everyone assumes someone else is handling it.
FinOps maturity beyond one project. It’s one thing to cut $2,000/month. It’s another to build a cost-conscious culture across 12 teams, 30 repos, and 6 environments.
Time constraints. You’re running a business. You don’t have 12 hours/week to audit CSV exports, tune alert thresholds, and negotiate RI purchases.
Most teams reach this inflection point within 3–6 months of serious cost awareness. They’ve picked the low-hanging fruit. The next 20–40% savings are there, but they require expertise, tooling, and a process that doesn’t exist yet.
Bridge to Offer: How CloudArc Helps
This is where we come in.
CloudArc provides managed cloud cost optimization services—so you stop overpaying without becoming a FinOps expert.
What We Do
Assessment — Conduct a full bill audit, identify zombie resources, perform a tag gap analysis, and review RI/SP coverage.
Right-Sizing — Generate ML-driven recommendations, implement changes safely, and validate performance.
Governance — Automate tag policy enforcement, set up budget alerting, and implement CI/CD cost gates.
Commitment Strategy — Purchase Reserved Instances and Savings Plans, match scope appropriately, and mitigate risk.
Continuous Monitoring — Run weekly cost and usage reviews, set up automated anomaly alerts, and deliver monthly executive readouts.
What Makes It Different
We don’t ask you to migrate. We work within your current architecture.
You keep control. All changes are reviewed and approved by your team before implementation.
We track savings transparently. You get a monthly report showing exactly what we saved you, against our fee.
We handle the operational heavy lifting. No extra tickets for your engineers, no confusing dashboards you never check.
Who Benefits Most
Organizations with:
$5,000–$500,000+/month in cloud spend
Multi-team, multi-environment complexity
No dedicated FinOps headcount
Pressure to reduce OpEx without slowing innovation
Call to Action
If your cloud bill has grown faster than your revenue for the last 3 months, it’s time for a second look.
We’ll review your last month’s bill, identify your top 5 cost leaks, and provide a prioritized savings plan—no obligation, no hard sell.
Audit takes ~30 minutes. Results delivered within 48 hours.
Social Proof: What We’ve Found
Across 100+ assessments, we consistently find:
Idle or oversized instances — Found in 88% of assessments. Average monthly savings: 18–25%.
Unassociated IPs / orphaned storage — Found in 72% of assessments. Average monthly savings: 4–8%.
Inefficient RI / Savings Plan usage — Found in 63% of assessments. Average monthly savings: 12–20%.
Cross-region transfer inefficiencies — Found in 51% of assessments. Average monthly savings: 3–7%.
Most clients recoup their assessment cost in under 2 months and achieve a 3–5× ROI in the first year.